Explaining multilevel models
A new analysis of NAPLAN data reconfirms that while students’ backgrounds influence their literacy and numeracy achievement, their results are not wholly determined by socioeconomic background. It also shows that differences between students explain more variation in results than differences between schools.
This research re-evaluates indicators of student disadvantage commonly shown to predict achievement. It was commissioned by AERO and undertaken Philip Holmes-Smith, Director of School Research, Evaluation and Measurement Services.
The research examines data from students who completed NAPLAN tests in Years 3, 5, 7 and 9, from 2013 to 2019. We used a specialised analytic approach known as multilevel modeling, providing insights beyond the public reports of average NAPLAN results for students from different backgrounds.
Multilevel models enable us to:
- quantify average achievement differences between schools and identify features of school contexts that might explain these differences
- examine student achievement after accounting for these school-level differences
- identify features of student backgrounds that might explain the difference in individual achievement over and above the influence of schools.
Repeating these analyses with several years of data provides more information about any differences between student cohorts or year levels.
What we learnt
Average differences between schools
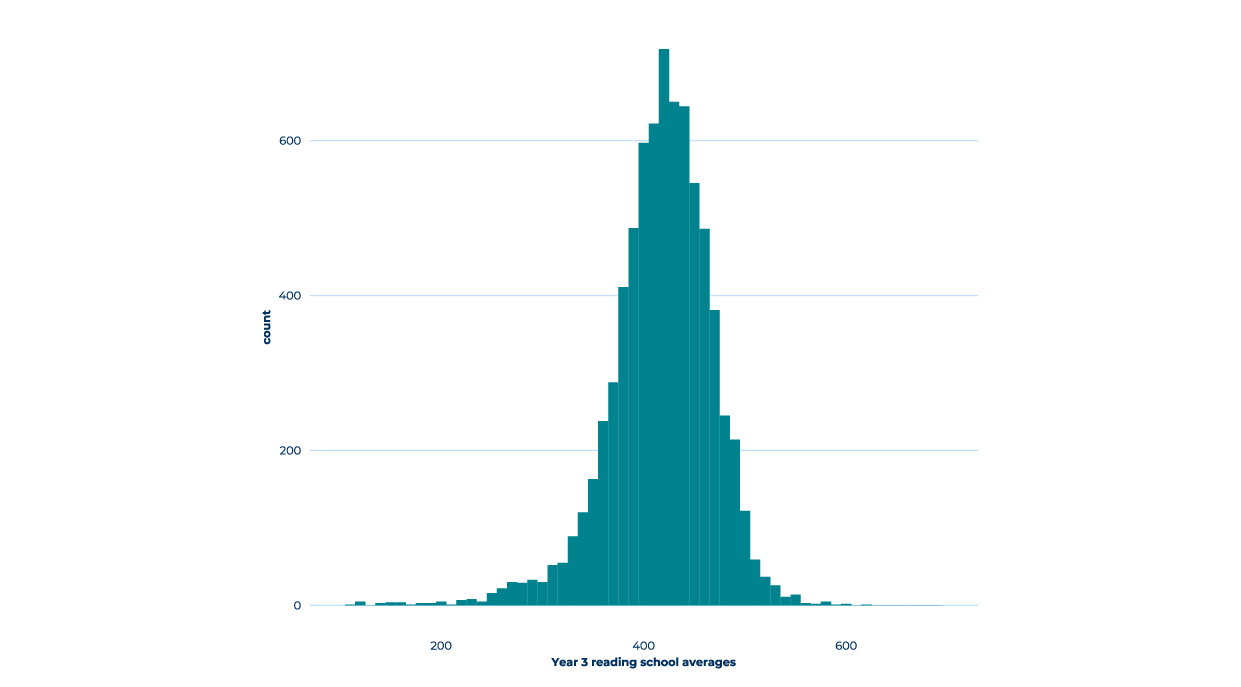
The results show there are considerable differences between schools in NAPLAN achievement each year. When all students’ scores within each school are averaged, some schools have very high performance, some very low and others cluster in the middle (see Figure 1).
Figure 1.A Distribution of school average scores for Year 3 reading in 2016.

Figure 1.B Distribution of school average scores for Year 3 numeracy in 2016.

In Years 3 and 5, differences between schools across every year of data captured:
- 25-32% of the variance in literacy achievement
- 20-24% of the variance in numeracy achievement.
In Years 7 and 9, differences between schools captured:
- 34-37% of the variance in literacy and
- 30-40% of the variance in numeracy.
These results indicate that average differences between schools partly explain why some students achieve better scores on NAPLAN tests than others. Schools with a low average have fewer students with high individual scores, whereas schools with a high average have more students with high individual scores and fewer students with low individual scores. This effect is stronger in Year 7 and Year 9 which, in most states and territories, are secondary school years.
Individual differences in achievement
After average differences between schools are accounted for, the remaining variance in NAPLAN achievement represents differences relating to individual students, regardless of school. This proportion of variance is easily calculated by subtracting the variance at the between-school level from 100%.
So, for Years 3 and 5, individual differences not related to school average capture:
- 68-75% of the variance in students’ literacy achievement
- 76-80% of the variance in numeracy achievement.
Similarly, for Years 7 and 9:
- 63-66% of the variance in literacy
- 60-70% of the variance in numeracy can be explained by differences between students, not including school effects.
Why this matters
Measuring the proportion of variance in NAPLAN assessments that can be attributed to differences between schools and differences between students regardless of the school they attend, is important baseline information for designing educational interventions aimed at improving student achievement.
To improve equity gaps in education, this research can help identify whether interventions will be most impactful at a whole-school or individual level.
As a higher proportion of the variability in NAPLAN scores can be attributed to differences between individual students, regardless of the school they attend, proposals for improving student achievement that target whole schools may not have as great an impact as we might wish.
Instead, interventions targeting individual students, groups of underachieving students or students from disadvantaged backgrounds, might have a greater impact in reducing inequities in academic outcomes. This is important information to know before designing and implementing educational interventions and can be useful for effectively evaluating programs aimed at reducing equity gaps in Australian students’ achievement.
Keywords: educational data, data analysis, student progress